Project Overview
This strategic analysis evaluated the potential revenue gains and operational efficiencies achievable through upgrading security screening systems to enable faster fan entry times. The project focused on monetizing the relationship between reduced wait times and increased merchandise/concession sales to build a comprehensive ROI case for system upgrades.
Analysis Objectives
- Quantify lost revenue due to current entry bottlenecks and wait times
- Model potential revenue gains from faster entry and increased dwell time
- Calculate staffing cost reductions from automated security systems
- Evaluate wait times/Per Cap metrics and develop ROI projections
- Provide data-driven recommendations for security infrastructure investment
Analysis Methodology
The analysis centered on equating time spent waiting in security lines to measurable lost revenue opportunities.
Data Processing Approach
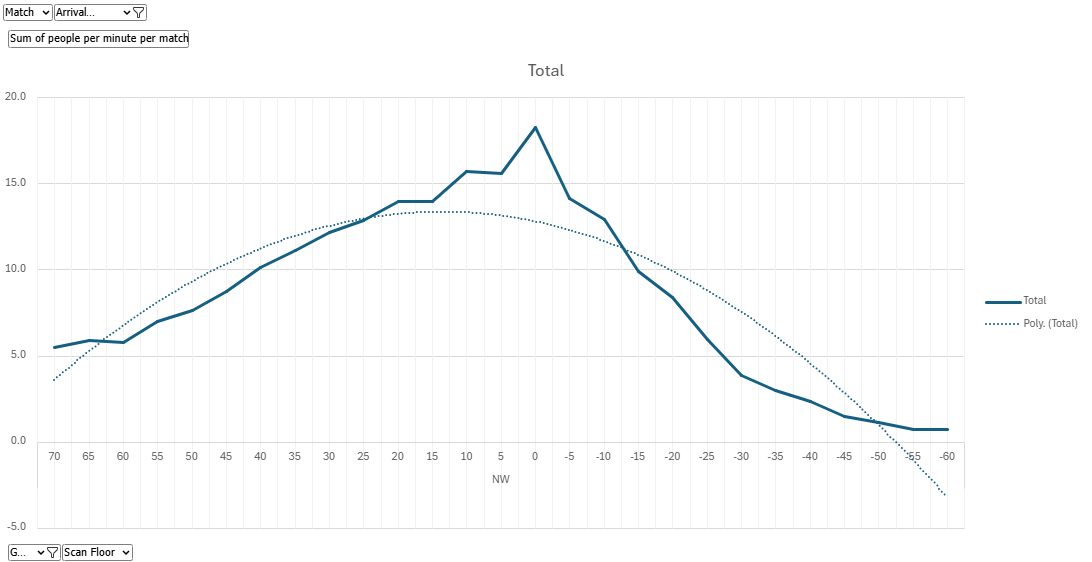
- Timestamp Analysis - Processed entry scan data to identify peak traffic periods
- Throughput Modeling - Used polynomial trendlines to define maximum throughput thresholds
- Peak Entry Periods - Identified 5-minute intervals operating above average throughput
- Wait Time Calculation - Used Ticket Scans, Throughput Rates, and Peak Period Lengths to define average wait times
- Revenue Correlation - Linked entry delays to concession/merchandise spending patterns
- Cost-Benefit Analysis - Compared upgrade costs against projected revenue gains
Data Sources & Integration
The analysis integrated multiple data streams to create a comprehensive view of security operations and revenue impact across all event types.
Primary Data Sources
- Event attendance and gate entry timestamps - Real-time throughput analysis
- Net revenue for merchandise and concession sales - Revenue correlation modeling
- Hourly staffing schedules and labor costs - Operational cost analysis
- Security vendor pricing and upgrade options - Investment cost modeling
- Fan satisfaction surveys - Experience impact assessment
Gate Performance Analysis
Individual gate analysis revealed significant variations in throughput efficiency and wait times, identifying specific bottlenecks and optimization opportunities.
Northwest Gate
Northeast Gate
Southwest Gate
Southeast Gate
Business Impact & Results
Through comprehensive data analysis and financial modeling, I successfully demonstrated that security system upgrades could be implemented at zero net cost while generating significant additional revenue through operational improvements.
Cost-Neutral Implementation Strategy
My analysis revealed that labor cost savings from automated security systems would completely offset the equipment and installation costs, while decreased wait times would drive substantial revenue increases through:
- Extended Dwell Time - Fans entering faster spend more time (and money) inside the venue
- Reduced Abandonment - Shorter lines prevent fans from leaving due to frustration
- Improved Fan Experience - Better entry experience correlates with increased concession spending
- Staffing Optimization - Automated systems require 30% fewer security personnel per gate
Strategic Recommendations
Based on the comprehensive analysis, the data supports an investment in enhanced security systems with a phased implementation approach to maximize ROI and minimize operational disruption.
- Implementation Strategy - Phased approach, pilot programs, training
- Industry Best Practices - Benchmarking, integration, compliance
- Risk Mitigation - Contingency planning, backup protocols
- Success Metrics - KPIs, satisfaction tracking, benchmarks
- Technology Considerations - Integration, security, maintenance
Visualizations
*Analysis based on 2024-2025 ticket scan data and match statements